The Management’s Discussion and Analysis (MD&A) provides an overview of the financial position and activities of the University of Florida (the University) for the fiscal year ended June 30, 2020, and should be read in conjunction with the financial statements and notes thereto.
THE UNIVERSITY OF FLORIDA (the University) is a component unit of the State of Florida and one of only 17 universities in the country to have the distinction of land, sea and space grant status. As the State’s flagship university, it is the only Florida institution to belong to the prestigious Association of American Universities. In addition, the University is one of only six in the country with colleges of law, medicine, agriculture, and veterinary medicine on one central campus, as well as undergraduate and graduate degrees available via distance and online learning. For the fourth year in a row, the University of Florida rose in the U.S. News & World Report rankings, based on up to fifteen key measures of quality, once again remaining the most highly ranked university in Florida and the only university in the state in the top 10. As the University continues to climb, it remains highly accessible to students, its sixteen colleges offering students almost 100 undergraduate majors and 200 graduate programs, with an affordable tuition that allows more than half of the University’s graduates to leave with no student loan debt.
The University of Florida’s student population of over 56,000 makes it an integral part of Gainesville, a town of approximately 134,000 residents and the University’s host city. The University of Florida has adopted a strategic development plan, based on an exploration of key issues within the university community and the City of Gainesville, which seeks to shape the University and the surrounding community’s future over the next 40 to 50 years. This future is based on sustainable growth - with a 2,000-acre campus and more than 900 buildings, including the first Leadership in Energy and Environmental Design (LEED) Platinum-certified building in the state of Florida, the University now has more LEED-certified buildings than any other American university.
The financial reporting entity for the financial statements includes the University and its component units. Note 1 to the financial statements provides detailed information on the financial reporting entity and discretely presented component units.
This overview is required by Governmental Accounting Standards Board (GASB) Statement No. 35, Basic Financial Statements – and Management’s Discussion and Analysis – for Public Colleges and Universities, as amended by GASB Statements Nos. 37 and 38. The MD&A, financial statements, and notes thereto, are the responsibility of University management. The MD&A contains financial activity of the University for the fiscal years ended June 30, 2020, and June 30, 2019.
The University continues to maintain and protect its strong financial position, with assets of $4.4 billion at June 30, 2020. This reflects a $88.0 million, or 2.1%, increase from the 2018-19 fiscal year. During the fiscal year, the total investments increased $44.4 million. The primary investment objective of the University is the safety of the University’s principal and liquidity. Secondary to this responsible financial stewardship is the optimization of investment income. The University succeeded in both objectives during the fiscal year, maximizing the use of available funds in a prudent manner.
In addition, the capital assets increased $42.9 million, primarily due to additional work in progress, as the University continues to invest in updated facilities, including modern research laboratories and classrooms, in support of the University’s strategic plan.
While total assets increased, liabilities also increased by $231.2 million, or 9.5%, totaling $2.7 billion at June 30, 2020, primarily due to the change in Other Postemployment Benefits Payable (OPEB). The OPEB liability is determined by an actuarial valuation for the expected payments needed to fund projected plan benefits.
Net position represents the residual interest in the University’s assets and deferred outflows of resources after deducting liabilities and deferred inflows of resources. The University’s net position decreased by $15.3 million, resulting in a year-end balance of $1.9 billion.
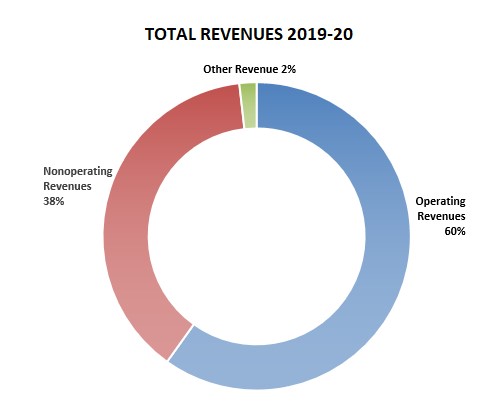
The University of Florida has a strong and diverse revenue base. Operating revenues, which are revenues generated by the University in fulfilling its instruction, research, and public service missions, totaled $2.0 billion for the 2019- 20 fiscal year, with a 0.5% increase over the 2018-19 fiscal year, a slight increase despite the impact of the COVID-19 pandemic on third and fourth quarter operations. Major components of operating revenues are Student Tuition and Fees and Grants and Contracts.
Student Tuition and Fees, net of Scholarship Allowances, increased by $24.6 million, or 6.6% as the University witnessed a slight increase in enrollment, primarily for out-of-state graduate students.
The University of Florida is recognized by U.S. News & World Report as one of the Top 10 public research universities in the United States and, as such, Grants and Contracts revenue is essential to the University’s success in fulfilling its mission. As the University continues to benefit from the Faculty 500 hiring initiative, the current studentfaculty ratio is 17:1, compared to 21:1 five years ago. This new talent will enhance the University’s ability in securing competitive research funding and provide graduate and undergraduate students an opportunity to work with these top scholars and researchers as part of their educational experience.
The following chart provides a graphical presentation of the University’s total revenues by category for the 2019-20 fiscal year:
Operating expenses totaled $3.4 billion for the 2019-20 fiscal year, representing a $154.0 million, or 4.8%, increase compared to the 2018-19 fiscal year. The largest category contributing to this increase was Employee Compensation and Benefits, underlining the University’s commitment toward recruiting and retaining exceptional faculty and staff.
State Appropriations, Net Investment Income and Noncapital Grants, Contracts, and Gifts are all considered nonoperating revenues as they are not generated by the University’s primary, ongoing operations. Net nonoperating revenues and expenses in the 2019-20 fiscal year increased by $9.8 million over the prior year, as federal Coronavirus Aid, Relief, and Economic Security Act (CARES Act) funding offset reductions in other revenue sources.
Pursuant to GASB Statement No. 35, the University’s financial report includes three basic financial statements: the Statement of Net Position; the Statement of Revenues, Expenses, and Changes in Net Position; and the Statement of Cash Flows. The financial statements and notes thereto encompass the University and its component units.
The Statement of Net Position reflects the assets, deferred outflows of resources, liabilities, and deferred inflows of resources of the University by employing the accrual basis of accounting, and presents the financial position of the University at a specified time. Net position, the difference between total assets and deferred outflows of resources and total liabilities and deferred inflows of resources, is one indicator of the University’s current financial condition. The changes in net position that occur over time indicate improvement or deterioration in the University’s financial condition.
The Statement of Revenues, Expenses, and Changes in Net Position represents the University’s revenue and expense activity, categorized as operating and nonoperating. Revenues and expenses are recognized when earned or incurred, regardless of when cash is received or paid. GASB Statement No. 35 categorizes revenues and expenses as either operating or nonoperating. Operating revenues generally result from exchange transactions where each of the parties to the transaction either gives or receives something of equal or similar value.
The majority of the University’s expenses are operating expenses as defined by GASB Statement No. 35. GASB gives financial reporting entities the choice of reporting operating expenses in the functional or the natural classifications. The University has chosen to report the expenses in their natural classification on the Statement of Revenues, Expenses, and Changes in Net Position and has displayed the functional classification in the Operating Expenses table and in the notes to the financial statements.
Certain revenue sources that the University relies on to provide funding for operations, including State Noncapital Appropriations, certain gifts and grants, and investment income, are defined by GASB as nonoperating. Nonoperating expenses include capital financing costs and other costs related to capital assets.
Other Revenues are composed of State Capital Appropriations and Capital Grants, Contracts, and Donations.
The Statement of Cash Flows provides information about the University’s financial results by reporting the major sources and uses of Cash and Cash Equivalents. This statement assists in evaluating the University’s ability to generate net cash flows, its ability to meet its financial obligations as they come due, and its need for external financing. Cash flows from operating activities reflect the net cash used by the operating activities of the University. Cash flows from capital and related financing activities include activities of the capital funds and related longterm debt. Cash flows from investing activities reflect the net source and use of cash related to the purchases and sales of investments and income earned on those investments. Cash flows from noncapital financing activities include those activities not covered in the other sections.
The University’s basic financial statements include discretely presented component units categorized as follows:
Direct-Support Organizations are separate, not-for-profit corporations organized and operated exclusively to assist the University in achieving excellence by providing supplemental resources from private gifts, bequests, and valuable education support services.
Health Science Center Affiliates are the several corporations closely affiliated with the University of Florida J. Hillis Miller Health Science Center, including the Faculty Practice Plans.
Shands Hospital and Othersincludes Shands Teaching Hospital and Clinics, Inc., a not-for-profit corporation that is contractually obligated to manage, operate, maintain, and insure the hospital facilities in support of the programs of the Health Science Center at the University of Florida. In addition, this category includes the University of Florida Self-Insurance Program and the University of Florida Healthcare Education Insurance Company.
The following table summarizes the University’s assets, deferred outflows of resources, liabilities, deferred inflows of resources, and net position at June 30:
| Condensed Statement of Net Position (in millions) | ||
|---|---|---|
| 2020 | 2019 | |
| Assets: | ||
| Current Assets | $ 1,933.4 | $ 1,914.6 |
| Capital Assets, Net | 2,062.9 | 2,020.0 |
| Other Noncurrent Assets | 378.7 | 352.4 |
| Total Assets | 4,375.0 | 4,287.0 |
| Deferred Outflows of Resources | 459.3 | 335.2 |
| Total Assets and Deferred Outflows of Resources | 4,834.3 | 4,622.2 |
| Liabilities: | ||
| Current Liabilities | 429.6 | 470.6 |
| Noncurrent Liabilities | 2,232.9 | 1,960.7 |
| Total Liabilities | 2,662.5 | 2,431.3 |
| Deferred Inflows of Resources | 273.4 | 277.2 |
| Total Liabilities and Deferred Inflows of Resources | 2,935.9 | 2,708.5 |
| Net Position: | ||
| Net Investment in Capital Assets | 1,903.9 | 1,883.9 |
| Restricted | 366.5 | 283.4 |
| Unrestricted | (372.0) | (253.6) |
| Total Net Position | $ 1,898.4 | $ 1,913.7 |
The increase in assets followed a rise in total investments of $44.4 million. Investments increased primarily as a result of the University’s reinvestment of income earned on institutional investments. Capital assets, depreciable and nondepreciable, increased by $42.9 million. The increase in capital assets demonstrates the continued importance the University places on providing modern facilities to enhance research and education.
The increase in current assets is a result of an $18.8 million increase in Net Accounts Receivable, primarily due to additional amounts receivable on federal grants and contracts.
Alternatively, current liabilities decreased due to a combined decrease of $53.1 million in Accounts Payable, Due to Component Units/University, and Unearned Revenue.
The large increase in noncurrent liabilities is primarily due to a $195.2 million increase in Other Postemployment Benefits payable (OPEB) and a $81.6 million increase in the noncurrent portion of Net Pension Liability. GASB Statement No.75, Accounting and Financial Reporting for Postemployment Benefits other than Pensions, requires employers participating in benefit plans other than pensions to report the projected benefit liability in accordance with the standard. The benefit liability is largely driven by actuarial valuations and measurements based on claims cost, age-adjusted premiums, benefit terms and legal agreements existing at the measurement date. Statement No. 68, Accounting and Financial Reporting for Pensions, requires employers participating in cost-sharing multiple-employer, defined benefit pension plans to report the employers’ proportionate share of the net pension liabilities of the defined benefit pension plans. The change in the Net Pension Liability is driven in part by the market performance for the plan assets as of the measurement date for the plan liabilities.
The reported deferred outflows of resources and deferred inflows of resources are also required under GASB Statements No. 68 and No. 75.
The following table summarizes the University’s activity for the 2019-20 and 2018-19 fiscal years:
| Condensed Statement of Revenues, Expenses, and Changes in Net Position (in millions) | ||
|---|---|---|
| 2019-20 | 2018-19 | |
| Operating Revenues | $ 2,019.1 | $ 2,009.8 |
| Operating Expenses | (3,387.5) | (3,233.5) |
| Operating Loss | (1,368.4) | (1,223.7) |
| Net Nonoperating Revenues | 1,292.4 | 1,282.6 |
| Income (Loss) Before Other Revenues | (76.0) | 58.9 |
| Other Revenues | 60.7 | 98.9 |
| Increase (Decrease) in Net Position | (15.3) | 157.8 |
| Net Position, Beginning of Year | 1,913.7 | 1,755.9 |
| Net Postion, End of Year | $ 1,898.4 | $ 1,913.7 |
The University continues to maintain a diverse revenue stream which serves to protect the University from over-reliance on a single revenue source. This diversification has helped the University show resistance to revenue loss and maintain stability of operations despite unexpected conditions resulting from the COVID-19 pandemic.
The following table summarizes the operating revenues by source that were used to fund operating activities during the 2019-20 and 2018-19 fiscal years:
| Operating Revenues (in millions) | ||
|---|---|---|
| 2019-20 | 2018-19 | |
| Grants and Contracts | $ 1,443.6 | $ 1,442.0 |
| Student Tuition and Fees, Net of Scholarship Allowances | 399.6 | 375.0 |
| Sales and Services of Auxiliary Enterprises | 114.7 | 131.4 |
| Sales and Services of Educational Departments | 53.8 | 55.9 |
| Other | 7.4 | 5.5 |
| Total Operating Revenues | $ 2,019.1 | $ 2,009.8 |
Total operating revenues remained consistent with the prior year. The increase in net student tuition and fees of $24.6 million is primarily due to additional enrollment from out-of-state graduate students. Due to the University’s response to the COVID-19 pandemic, operations noticeably subsided to ensure the safety of students, faculty and staff. Sales and Services of Auxiliary Enterprises experienced the greatest impact of this, with a decrease of $16.7 million.
The following table summarizes the operating expenses for each method of classification for the 2019-20 and 2018-19 fiscal years:
| Operating Expenses (in millions) | ||
|---|---|---|
| Natural Classification | 2019-20 | 2018-19 |
| Employee Compensation and Benefits | $ 2,429.9 | $ 2,271.6 |
| Services and Supplies | 528.7 | 577.4 |
| Scholarships, Fellowships, and Waivers* | 199.0 | 163.1 |
| Depreciation | 154.4 | 143.1 |
| Utilities and Communications | 75.5 | 78.3 |
| Total Operating Expenses | $ 3,387.5 | $ 3,233.5 |
| Functional Classification | 2019-20 | 2018-19 |
| Instruction | $ 799.0 | $ 770.5 |
| Public Service | 784.9 | 742.1 |
| Research | 739.8 | 707.2 |
| Academic Support | 239.6 | 213.7 |
| Scholarhsips, Fellowships and Waivers* | 199.0 | 163.1 |
| Institutional Support | 169.4 | 180.5 |
| Depreciation | 154.4 | 143.1 |
| Operation and Maintenance of Plant | 132.9 | 132.5 |
| Auxiliary Enterprises | 120.9 | 134.0 |
| Student Services | 47.6 | 46.8 |
| Total Operating Expenses | $ 3,387.5 | $ 3,233.5 |
| *Net of Scholarship Allowances of $267.7 million in the 2019-20 fiscal year and $224.7 million in the 2018-19 fiscal year | ||
Operating expenses increased primarily due to a $158.3 million increase in Employee Compensation and Benefits, which was driven by a rise in the number of faculty and staff working at the University, a Universitywide pay raise during the 2019-20 fiscal year, and an increase in pension expense as determined by the pension liability calculation. This overall increase is in direct alignment with the University’s strategic plan, a key part of which is attracting and retaining talented faculty and staff. Services and Supplies decreased $48.7 million primarily due to reduced utilization of contractual services by the University and travel restrictions implemented state-wide in response to the COVID-19 pandemic. Finally, Scholarships, Fellowships and Waivers increased $35.9 million primarily due to CARES Act grants disbursed to students as aid in response to the COVID-19 pandemic, as well as increases in amounts disbursed under other scholarship programs, net of allowances.
The following table summarizes the University’s nonoperating revenues and expenses for the 2019-20 and 2018-19 fiscal years:
| Nonoperating Revenues (Expenses) (in millions) | ||
|---|---|---|
| 2019-20 | 2018-19 | |
| State Noncapital Appropriations | $ 788.6 | $ 790.4 |
| Federal and State Student Financial Aid | 244.3 | 231.2 |
| Noncapital Grants, Contracts, and Gifts | 185.0 | 184.5 |
| Investment Income, Net of Expenses | 43.7 | 49.8 |
| Net Increase in Fair Value of Investments | 16.8 | 32.6 |
| Loss on Disposal of Capital Assets | (0.1) | (0.2) |
| Interest on Capital Asset-Related Debt | (6.7) | (6.1) |
| Other Net Nonoperating Expenses | 20.8 | 0.4 |
| Net Nonoperating Revenues | $ 1,292.4 | $ 1,282.6 |
Net Nonoperating Revenues remained consistent when compared to the prior year. Other Net Nonoperating Revenues increased as the University received $22.8 million in CARES Act funding in response to COVID-19. However revenues from the Net Increase in the Fair Value of Investments decreased by $15.8 million due to market performance of the University’s investments as compared to the prior year.
The following table summarizes the University’s other revenues for the 2019-20 and 2018-19 fiscal years:
| Other Revenues (in millions) | ||
|---|---|---|
| 2019-20 | 2018-19 | |
| State Capital Appropriations | $ 46.1 | $ 73.4 |
| Capital Grants, Contracts, and Donations | 14.6 | 25.5 |
| Total Other Revenues | $60.7 | $ 98.9 |
The decrease of $38.2 million in Other Revenues is primarily due to a decrease Florida’s Public Education Capital Outlay funding from the State.
The following table summarizes cash flows for the 2019-20 and 2018-19 fiscal years:
| Condensed Statement of Cash Flows (in millions) | ||
|---|---|---|
| 2019-20 | 2018-19 | |
| Cash Provided (Used) by: | ||
| Operating Activties | $ (1,082.3) | $ (1,050.8) |
| Noncapital Financing Activities | 1,206.3 | 1,251.6 |
| Capital and Related Financing Activities | (150.1) | (107.7) |
| Investing Activties | 20.0 | (86.4) |
| Net Increase (Decrease) in Cash and Cash Equivalents | (6.1) | 6.7 |
| Cash and Cash Equivalents, Beginning of Year | 13.0 | 6.3 |
| Cash and Cash Equivalents, End of Year | $ 6.9 | $ 13.0 |
The University’s Statement of Cash Flows is based on the reporting structure outlined by the Governmental Accounting Standards Board (GASB). Much of the University’s cash used to fund operating expenses is provided from non-exchange transactions such as State Appropriations, Financial Aid and Noncapital Grants, Contracts, and Gifts. These revenues are considered non-operating under GASB standards and are reflected as such in the University’s Statement of Cash Flows.
Major sources of funds for the University came from Grants and Contracts ($1,423.6 million), State Noncapital Appropriations ($788.6 million), Student Tuition and Fees, Net ($395.1 million), Federal and State Financial Aid ($244.3 million), and Noncapital Grants, Contracts, and Gifts ($185.0 million). Major uses of funds were for Payments to Employees ($2,258.3 million), Payments to Suppliers for Goods and Services ($615.4 million), and the Purchase or Construction of Capital Assets ($196.8 million).
At June 30, 2020, the University had approximately $4.6 billion in capital assets, less accumulated depreciation of $2.5 billion, for net capital assets of $2.1 billion. Depreciation charges for the current fiscal year totaled $154.4 million. Total Capital Assets increased in the 2019-20 fiscal year as construction continued on major projects. This increase reflects the University’s dedication to an infrastructure and learning environment that supports its mission and strategic plan. The following table summarizes the University’s capital assets, net of accumulated depreciation, at June 30:
| Total Capital Assets, Net (in millions) | ||
|---|---|---|
| 2020 | 2019 | |
| Land | $ 12.5 | $ 12.5 |
| Buildings | 1,517.6 | 1,525.4 |
| Infrastructure and Other Improvements | 53.1 | 47.9 |
| Furniture and Equipment | 219.6 | 210.6 |
| Library Resources | 47.8 | 46.4 |
| Property Under Capital Lease and Leasehold Improvements | 13.6 | 13.2 |
| Other Capital Assets | 35.1 | 43.1 |
| Construction in Progress | 163.6 | 120.9 |
| Total Capital Assets (Nondepreciable and Depreciable, Net) | $ 2,062.9 | $ 2,020.0 |
| Additional information about the University’s capital assets is presented in Note 8 to the financial statements. | ||
Major capital expenses were incurred during the fiscal year on the University’s largest ongoing projects, including Herbert Wertheim Laboratory for Engineering Excellence ($23.3 million), Veterinary Medicine Energy Plant ($17.6 million), and PK Yonge Middle & High School Expansion ($8.8 million), which are expected to transform the associated learning and research environments and support the continued growth of the campus community.
The University’s construction commitments at June 30, 2020, are as follows:
| Major Construction Commitments (in millions) | ||
|---|---|---|
| Total Commitments | $ 967.1 | |
| Completed to Date | 163.6 | |
| Balance Committed | $ 803.5 | |
| Additional information about the University's construction commitments is presented in Note 14 to the finanical statements. | ||
The University is mindful of its financial stewardship and manages resources effectively, including the prudent use of debt to finance capital projects. At June 30, 2020, the University had $158.4 million in outstanding capital asset-related debt. Capital asset related debt primarily consist of bonds issued to fund major construction projects such as student housing, research buildings, student activity centers, and parking garages. The following table summarizes the outstanding capital asset-related debt by type of debt at June 30:
| Capital Asset-Related Debt (in millions) | ||
|---|---|---|
| 2020 | 2019 | |
| Capital Improvement Debt | $ 149.5 | $ 159.5 |
| Loans and Notes | 4.3 | 4.7 |
| Installment Purchase Agreements | 2.6 | 0.5 |
| Capital Leases | 2.0 | 2.2 |
| Total Capital Asset-Related Debt | $ 158.4 | $ 166.9 |
| Additional information about the University's capital asset-related debt is presented in Note 12 to the finanical statements. | ||
The University of Florida remains financially secure despite the economic challenges posed by the COVID-19 pandemic. The Florida Economic Estimating Conference met on July 17, 2020 to adopt a new forecast for the State’s economy. The forecast for the State of Florida predicts a gradual recovery for the Florida economy through the 2021-2022 fiscal year from lows experienced at the onset of the pandemic. This recovery will span several key economic indicators, including personal income, job growth, employment, and tourism. However any rebound of economic activity will be constrained by the availability of an effective vaccine.
The University holds an AA+ rating from Standard and Poor’s Global Ratings (S&P), and an Aa2 rating from Moody’s Investor Services. An annual comment on these ratings issued by Moody’s in March 2020 predicted that the University will maintain its excellent strategic positioning despite rapidly evolving business conditions for the higher education sector as a whole brought on by the COVID-19 pandemic, with a widely recognized brand for education and research, favorable student demand, strong operating performance and wealth management, and a highly manageable debt burden enhancing the University’s resilience.
These strong ratings not only reflect the University’s financial strength and reputation as a leading provider of higher education, but also enable the University to obtain competitive debt financing to support its mission and realize its strategic plan.
The continued State support amid the pandemic are reflected in the University’s State Appropriations for the coming fiscal year. The General Revenue and Lottery allocation from the State budget totaled $825.9 million for the 2020-21 fiscal year; however, $49.1 million has been held back by order of the Governor in anticipation of potential statewide budget reductions when the legislature next convenes. As part of the 2020-21 budget, the University was allocated an additional $15.0 million in National Ranking enhancement funds, as well as $25.0 million in additional operational support funding; however, the effect of the holdback has thus far prevented the benefit of those allocations to be realized. Included in the overall allocation is $47.7 million in performance funds and $58.5 million in funding to support preeminence. Furthermore, the budget includes $16.8 million in funding for the World Class Faculty & Scholar Program and $16.7 million in funding for the State University Professional and Graduate Degree Excellence Program.
The 2020-21 fiscal year budget clearly reflects, even in a challenging economic environment, the sustained commitment of the Legislature and the Governor to support the University of Florida in its goal of becoming a top five public research university that the state, nation, and world look to for leadership.
Questions concerning information provided in the MD&A, financial statements and notes thereto, and other required supplementary information, or requests for additional financial information should be addressed to Alan M. West, Assistant Vice President and Treasurer, P.O. Box 113200, Gainesville, Florida 32611.